Braves ML sharp money card
2 legs quoted as 4.53 units, 6.12 at risk.
Expert MLB handicapping powered by advanced analytics and situational edges. Daily sharp-money cards with the price and units on every play.
Daily sharp-money cards through the regular season. Pitcher matchups, park factors, and the price on the board.
2 legs quoted as 4.53 units, 6.12 at risk.
4 legs quoted as 6 units, 10.67 at risk.
4 legs quoted as 6 units, 10.67 at risk.
1 legs quoted as 1.5 units, 3.45 at risk.
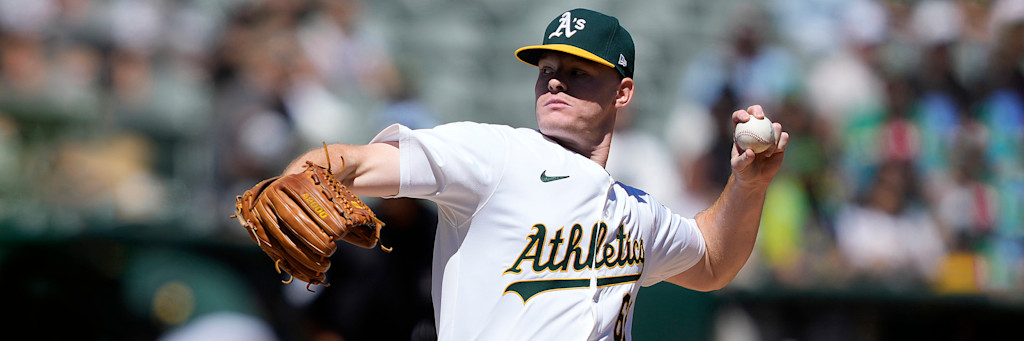
4 legs quoted as 5.5 units, 7.27 at risk.
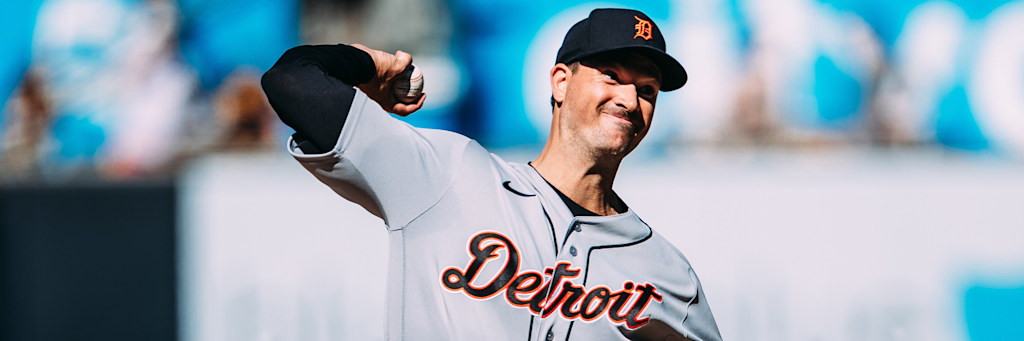
2 legs quoted as 4 units, 11.25 at risk.
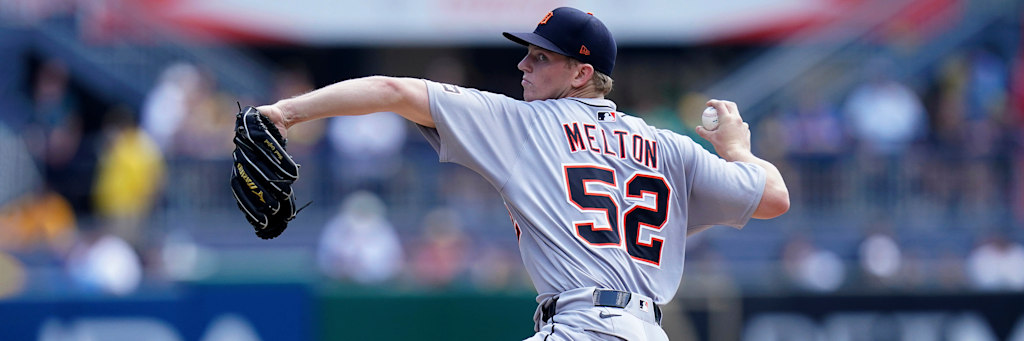
2 legs quoted as 5 units, 8.29 at risk.
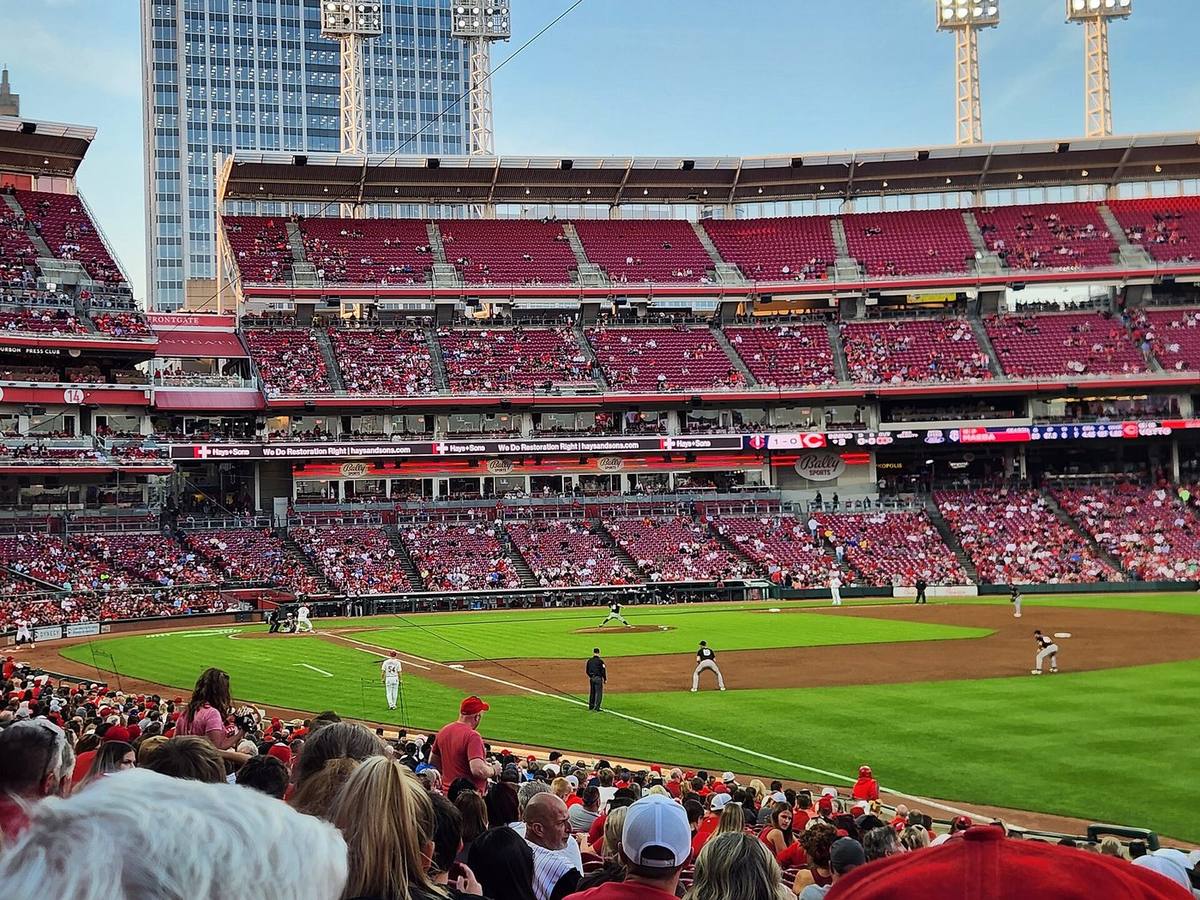
Six plays quoted as 11.5 units to win, 14.13 at risk. Five of the six are unders and the largest ticket, the Tigers and Guardians under 7 at -125, is only 26.5 percent of the card.

Nine legs quoted as 12 units, 15.72 at risk. Half the exposure is four team total unders and one ticket alone carries 19.7 percent of the card.
Three legs quoted as 6 units, 9.78 at risk. The two moneylines cost the same and return different amounts, and the ladder is flatter than yesterday.
Three legs quoted as 4 units, 5.29 at risk. Milwaukee Brewers moneyline -148 at 1.5 units to win is 42 percent of the card on its own.
Five legs quoted as 7 units, 9.27 at risk. The Angels team total under 3.5 at -148 is 31.9 percent of the card on its own.
Seven legs and 11.5 units, and the biggest stake is not the Cubs. It is 2.5 units on the under in San Diego. The prices, the break even math and what the sizing ladder says.
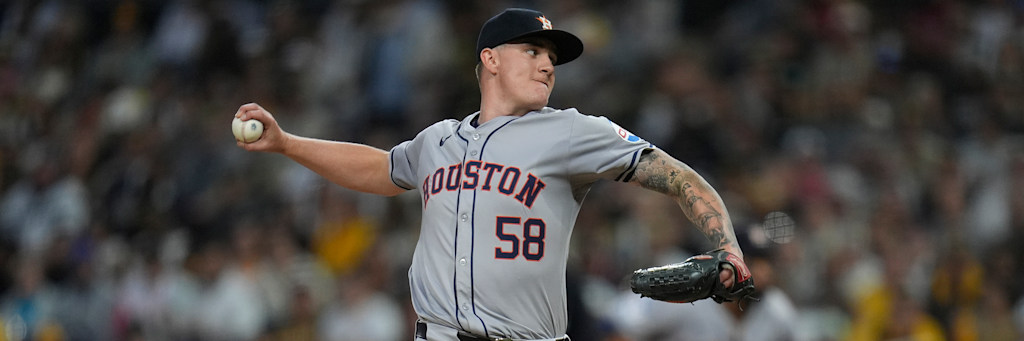
Two of tonight's 5.5 units sit on a Houston alternate run line of -1 at -180, where a one run win pushes. The prices, the break even math and the case against.
New York is laying almost nothing to win a game against the worst run prevention club in the AL East. One unit on the Yankees moneyline at -107, and the case against it.
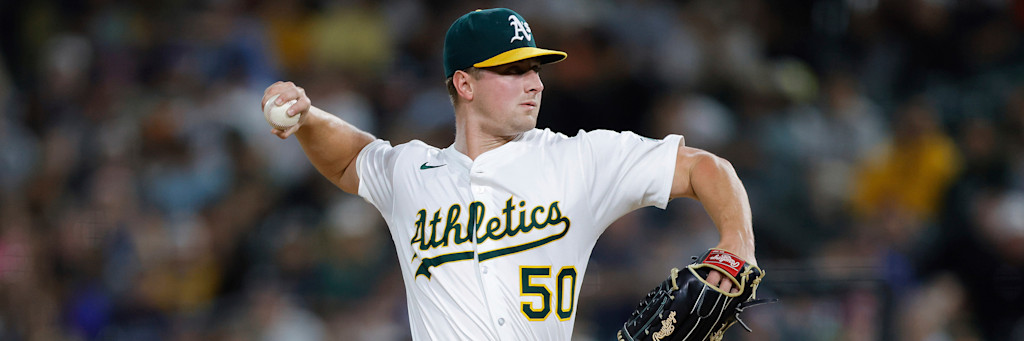
Nine plays and 15 units on a fifteen-game board. Two of those games have no announced starter, and the card has six units inside them.
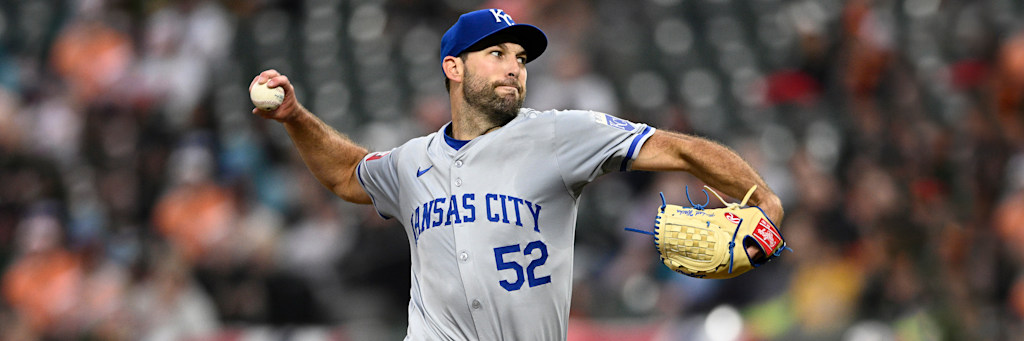
Two plays and 4.5 units: Kansas City -175 with Michael Wacha against a 12.0 percent walk rate, and Boston -132 in a staff game at Fenway against Mitch Bratt.
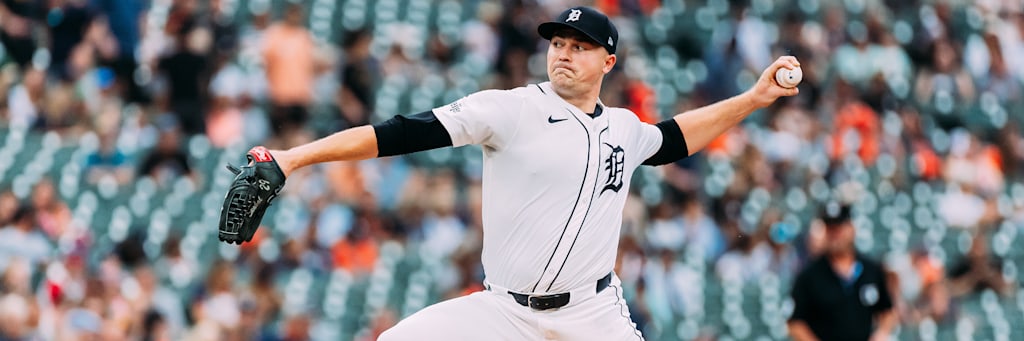
Three tickets Sunday, one model signal. Rangers moneyline, Astros/Mariners under, Dodgers team total, each bought on more than a team name.
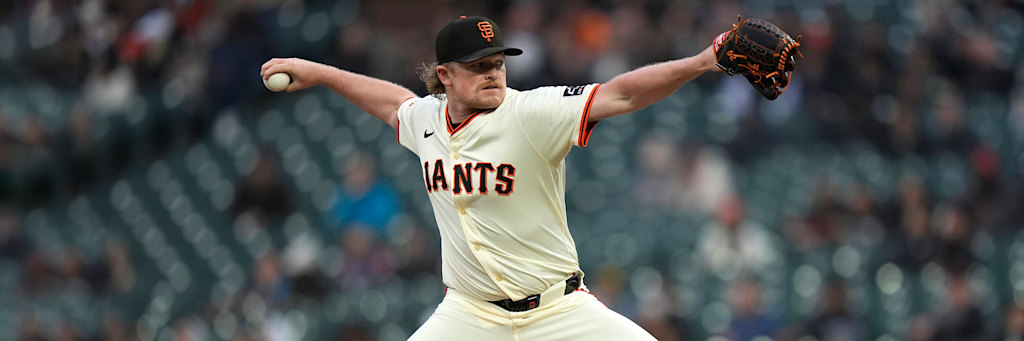
Six favorites, 11.5 units, a unit-weighted break-even of 58.4 percent. Every ticket is priced off a starting pitcher or a ballpark, not a team name.
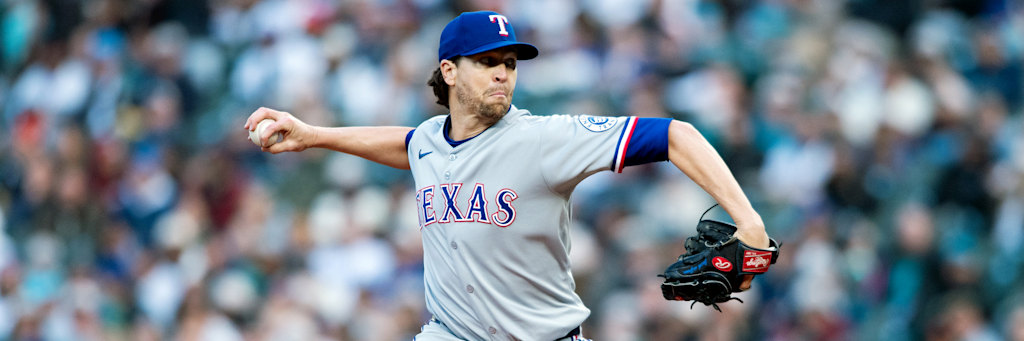
A two-play card built on opposite bets: the Angels held under 3.5 behind Jacob deGrom, and a Phillies-Twins over at the Field of Dreams in Iowa driven by Aaron Nola's home run rate.
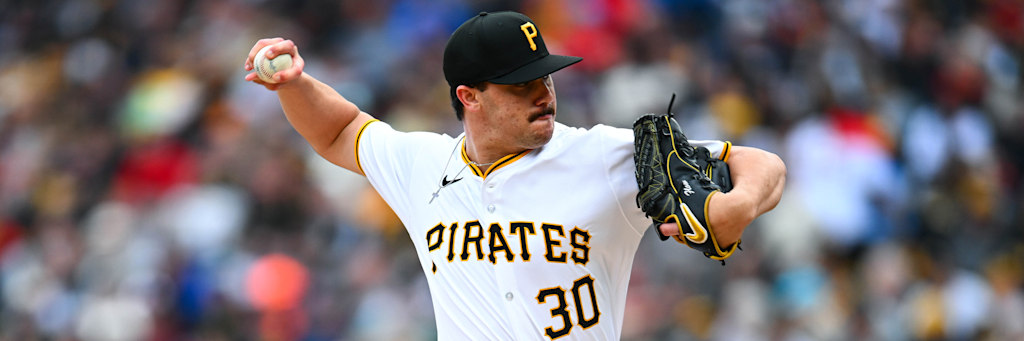
Eight plays, twelve units, no plus prices anywhere. The unit-weighted break-even lands on exactly sixty percent. Here is what each price actually buys.
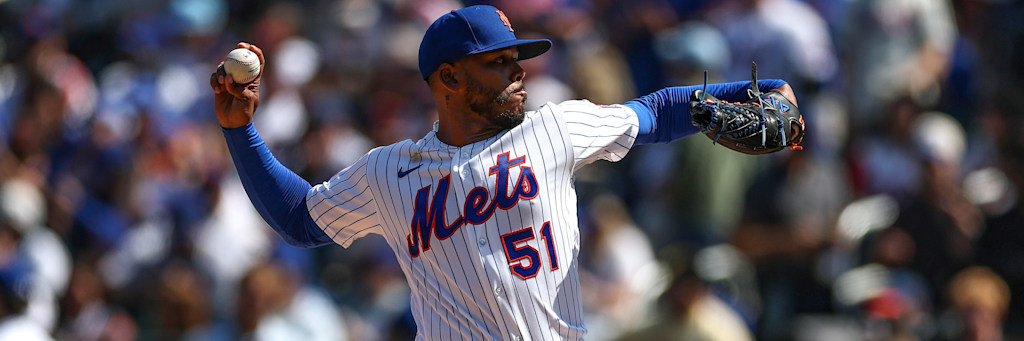
Three plays, three games, an average break-even above sixty percent. What each price on today's card is actually paying for, including one arm's disastrous last outing.
Six of thirteen units sit on two tickets priced at -230 and -198, prices that demand 69.7 and 66.4 percent just to break even. Here is what that money actually buys.
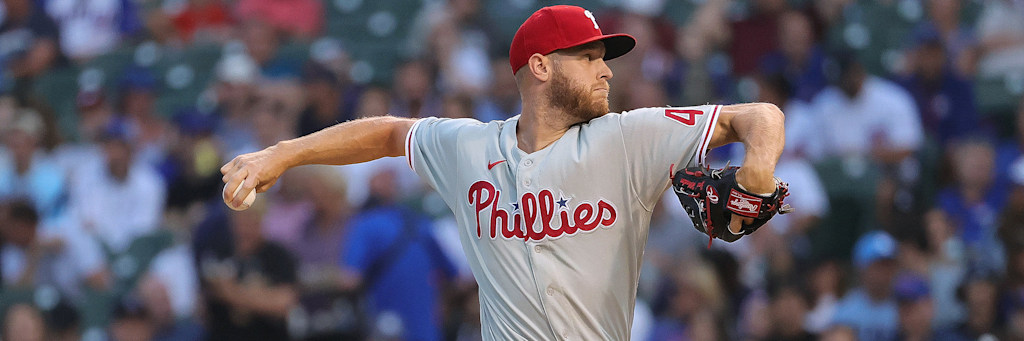
Six plays, 9.5 units. Two of them are decided by the arm on the mound. Two of them are priced on the roster behind him instead, and the pitching line actually argues the other way.
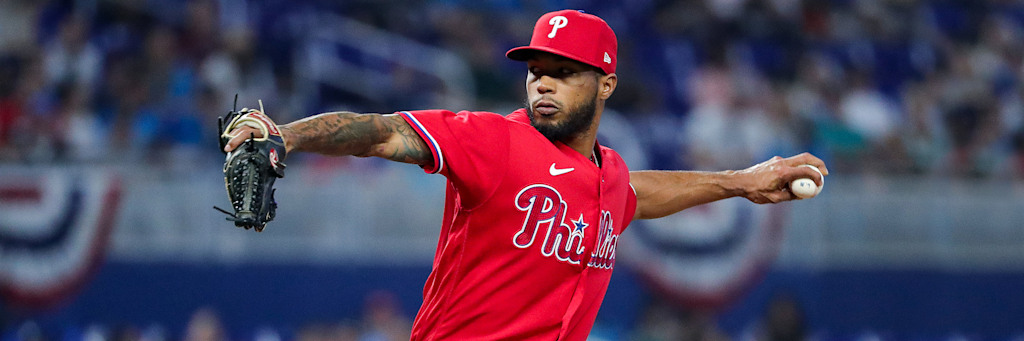
The Nationals team total under moves to 3.5 tonight behind Cristopher Sanchez's 2.61 ERA. Four plays, 5.5 units, led by an alternate line built for one pitcher.
12 comprehensive guides covering every angle of MLB handicapping. From park factors to umpire tendencies, reverse line movement to bullpen fatigue.
How to spot and exploit sharp money signals in MLB betting markets.
Coors Field park factor by year, including the 110 from 2024, plus current Statcast numbers for every stadium's runs, homers, and totals impact.
xFIP, FIP, and the metrics that actually predict pitcher performance.
The unit system, Kelly Criterion, and protecting your edge long-term.
Wind, humidity, and temperature effects on MLB totals and outcomes.
Strike zones, run environments, and which crews move the line.
Sharp angle reports and picks from the early-season slates.
The archive
Every published Best MLB Handicapper pick, analysis and betting recommendation, newest first.
Static crawl links updated September 5, 2026. These links are present in raw HTML for search engines.